Gold Weekly Report (XAUUSD): 2026-02-08–2026-02-15 | USD and Yields
1) Weekly snapshot
Report window: 2026-02-08–2026-02-15 (UTC). Last available trade in the dataset: 5037.84 at Fri, 13 Feb 2026 21:55 UTC.
2) Price action & OHLCV
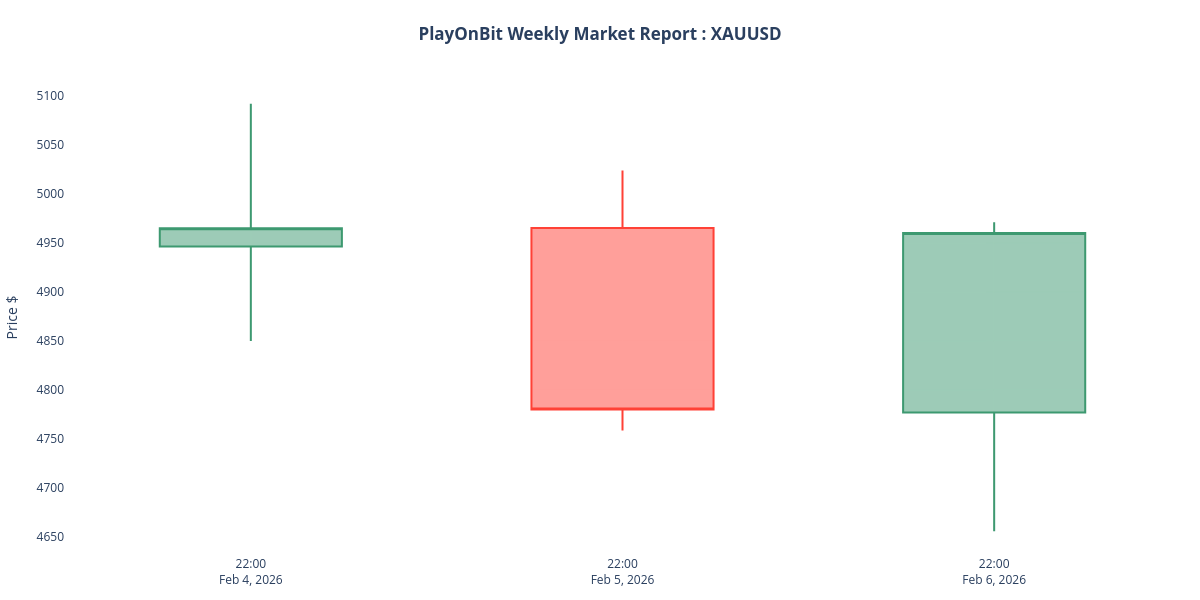
The dataset's 1w_summary (computed from the last completed Monday–Friday) records a weekly high of 5,091.71, a weekly low of 4,655.37 and a weekly close of 4,959.84 with aggregate volume 5,852,288. The open value in the 1w_summary is unavailable in the dataset and is explicitly flagged as null. Notes in the summary indicate the values are computed from the last completed Monday–Friday (UTC). Structurally, the wide high–low range and the close below the weekly high point to a corrective phase following earlier record highs, while the last quoted price (5037.84) sits above the weekly close, suggesting short-term recovery attempts after the dip. For a related technical discussion see our double-top neckline analysis.
3) Macro drivers: USD & yields
The US Dollar Index softened versus the prior week, easing from the mid 97s to a last recorded level near 96.8820, implying a modest USD headwind for gold. For more on dollar-driven moves see gold under pressure. Short- and medium-term US Treasury yields also moved lower across the week: the 5-year yield trended down to about 3.6090 and the 10-year to about 4.0560 at their last reported prints, reducing some rate-related pressure on XAUUSD. These moves are described cautiously in the dataset as part of an environment where incoming US data and Fed commentary remain the dominant drivers of near-term direction.
4) Calendar & catalysts
The week featured multiple high-volatility events and central-bank speeches that could swing risk sentiment. Key scheduled items in the dataset included Japanese General Elections on Sun, 08 Feb 2026 00:00 UTC, ECB President Lagarde speeches on Mon, 09 Feb 2026 16:00 UTC and Sat, 14 Feb 2026 16:30 UTC and Sun, 15 Feb 2026 09:30 UTC, US Nonfarm Payrolls on Wed, 11 Feb 2026 13:30 UTC and the US Consumer Price Index on Fri, 13 Feb 2026 13:30 UTC. The calendar also lists several Fed speakers across the week and data prints such as ADP (Tue, 10 Feb 2026 13:15 UTC) and the US monthly budget statement, all identified in the dataset as potential volatility triggers.
5) News themes (compressed)
Compressed news in the dataset highlights a mix of dominant themes: a sharp, algorithmic-driven selloff tied to AI concerns that amplified intraday metal liquidations; continued PBoC central-bank accumulation supporting structural central bank demand; and stronger US labor metrics and commentary that lifted yields and trimmed near-term rate-cut expectations. Corporate and sector items (for example, stronger AEM revenue and realized gold prices) appeared as bullish mid-term inputs. The dataset's news stats show 16 items summarized here with sentiment counts of 6 bullish, 5 bearish and 5 neutral, underscoring a conflicted market narrative of structural demand versus short-term risk-off/algorithmic pressure.
6) What to watch next week
Watch incoming US inflation prints and any follow-up Fed commentary closely, as both will be key to whether the USD and Treasury yields resume upward pressure or give way to further easing expectations. Monitor central-bank demand signals (notably continued PBoC purchases mentioned in the dataset) and any escalation in algorithmic-driven liquidations that could change intraday liquidity dynamics. Keep an eye on scheduled ECB and Fed speeches listed in the calendar and on the DXY/yields relationship for directional cues. For tactical support tools and order-flow assistance consider the Trade Assistant Bot and the Forex Trading Bot referenced on PlayOnBit.
7) Conclusion
Price structure this week showed a wide corrective range with mixed macro signals from the USD and yields; traders should prioritize event risk and liquidity management. For tools and further market signals visit PlayOnBit for resources and automated assistants.