Bitcoin Weekly Report (BTCUSDT): 2026-02-14–2026-02-21 | Funding Shifts
Weekly snapshot
This report window is 2026-02-14 to 2026-02-21 and summarizes the dataset for BTCUSDT. Spot price in the dataset is $68,180.11 and the perp mark is $68,147.53, producing a perp basis of -32.58. Funding rate in the data is a small positive 0.00002505. Open interest is listed as 81,130.110 in the dataset (units not specified). Overall tone from these metrics is mixed: small positive funding but a small negative basis with moderate OI, consistent with range-bound activity in the samples.
Price action & OHLCV
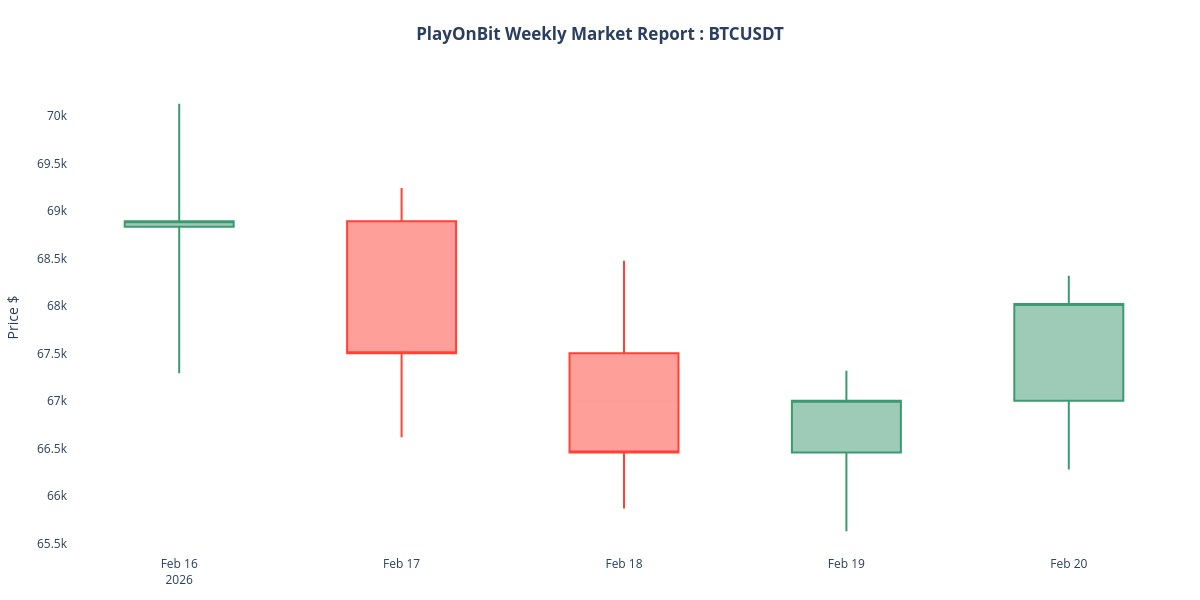
The dataset provides a 1w_summary for OHLCV computed from Monday (UTC) to the latest available candle within the week (capped at 2026-02-21T11:30:02.044Z). The 1w_summary shows open $68,832.59, range low→high 65,631.83→70,126.67, close $68,020.01, and aggregate volume ~97,391. Note that the summary covers available candles and is flagged as capped in the source.
Derivatives & leverage
Perp basis in the dataset is -32.58 (perp_mark slightly below spot) while funding is a small positive 0.00002505; small funding implies limited short-term carry pressure. Open interest sits near 81,130 (dataset units), which indicates a material but not extreme derivatives position pool. The provided futures_chain shows mixed marks across tenors (examples: near-dated and longer-dated futures around $68.3k–$69.0k) and the term_structure_slope is negative (-208.75). A negative slope and mixed tenor marks typically point to modest term premium shifts rather than extreme contango/backwardation, but such measures are probabilistic and should not be taken as causal proof of directional flow.
On-chain activity
The dataset includes two new-address snapshots showing new_addresses_values rising from 473,222 to 493,761 across the samples provided, which is a short-term participation proxy suggesting slightly higher onboarding in the sampled intervals. See our on-chain activity coverage for broader context. The sample is small and does not represent full-chain throughput; treat this as a directional clue rather than definitive market demand evidence.
Network conditions
Mempool fee metrics in the dataset are low: fastestFee 2 sat/vB and halfHourFee and hourFee at 1 sat/vB. Low fees reduce transaction-cost friction for on-chain flows, but these numbers are instantaneous snapshots and may not capture intra-week spikes or periods of congestion.
Liquidations
Liquidation totals were not provided in this dataset. Using the available funding, perp basis, and open interest as leverage proxies: small positive funding with a modest negative basis and OI near 81k suggests leverage was present but not extreme in the recorded samples. These indicators imply that liquidation risk exists if volatility accelerates, but they do not quantify realized liquidations.
Macro context
Macro series in the dataset show the dollar index rising into the week with the last DXY close around 97.8. Five-year Treasury yields are near 3.65% and ten-year yields around 4.09% in the latest samples, reflecting slightly firmer nominal yields alongside dollar strength. Multiple Fed speeches and key US data releases were scheduled in the window and represent potential volatility drivers referenced in the dataset.
News themes (compressed)
Compressed news items and counts from the dataset point to (1) continued spot ETF outflows and weakening institutional demand, (2) range-bound Bitcoin price action roughly between low 60k–mid 70k levels, (3) declining futures open interest and liquidity concerns that raise short-term liquidation risk, and (4) mixed technical and options signals with both bearish headlines and some short-term bullish or contrarian opportunities. The news sample counts are balanced with five bearish, five bullish, and four neutral pieces in the provided set.
What to watch next week
Monitor perp funding and perp basis for shifts that signal rising speculative leverage or rapid deleveraging. Watch open interest for sudden drops or spikes as a liquidity cue, and track volume relative to the weekly range. Key technical levels referenced in the dataset include downside support near the mid-60k area and upside resistance in the low 70k area; watch breaks or sustained holds around those zones. Macro event risk (Fed commentary, PCE/GDP prints) and ETF flow headlines can trigger elevated intraday volatility—manage position sizing accordingly.
Conclusion
This dataset paints a market that is range-bound with modest derivatives friction and low on-chain fees; treat signals as probabilistic and monitor funding, OI, and macro catalysts. For tools that help execute risk-managed strategies or automated approaches, see bitcoin trading bot and trade assistant.